Plot
UI object that displays a plot based on the output from a module.
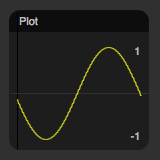
Example Plot View
The plot object acts as an oscilloscope that plots the current value of one or several outputs components.
As defult, only element 0 is ploted, but other elements can be selected using the select attributes that specifies a list of elements to plot. For example, the list "1, 3, 5" would select three elements with the specified indices.
The color of each plot can be set by supplying a list of colors in the 'color' attribute. For example, the list "red, green, blue" would set the colors of the first thee plots, The color names are standard HTML colors.
The plot object does not save its input. This means that if the object has not been in view for a number of ticks, it will not draw what happened during this time. Instead, it continues with the new values.
Example XML definitions
Basic example:
  <object
    class="Plot"
    module="MY_MODULE"
    source="MY_OUTPUT"
    x="0"
    y="0"
  />
Example of XML definition that plots the first two output elements in a matrix in red and green:
  <object
    class="Plot"
    module="MY_MODULE"
    source="MY_OUTPUT"
    x="0"
    y="0"
    select = "2, 7"
    color = "red, green"
  />
Attributes
| Attribute | Description | Default |
|---|---|---|
| class | must be "Plot" | |
| title | title of the object | module.source |
| x | placement of the object | |
| y | placement of the object | |
| w | width of the object | 1 |
| h | height of the object | 1 |
| module | name of the module to be visualized | |
| source | name of the output to be visualized | |
| min | minimum value; used to scale the plot | 0 |
| max | maximum value; used to scale the plot | 1 |
| select | selects what elements to plot | "0" |
| type | the type of plot (normal/stack) | normal |
| color | colors of the different plots | "yellow" |
| stroke_width | width of the lines | 1 |
| Attributes without default values must be specified. | ||
Author
Christian Balkenius
Lund University Cognitive Science
christian.balkenius@lucs.lu.se
Files
Plot.js