Path
The Path object draws one or several paths, lines or arrows. Lines can be draw with different widths, colors, patter, line endings and arrows. It is also possible to draw and fill polygons.
The example below shows the same data drawn with different formats.
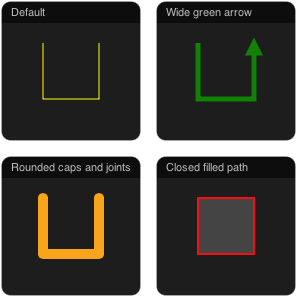
Example Path objects with different line types
The next example shows the ability to draw closed polygons with a transparent color fill.
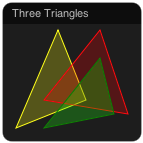
Using a 3x6 matrix to draw three transparent polygons
By default, each path is specified in a single row of a matrix. The coordinates of the vertices are listed sequentially in each row as x0, y0, x1, y1, etc. One path will be drawn for each row in the matrix and the number of vertices depends on the number of columns of the matrix.
The example below shows a matrix that would produce three paths with four vertices each. The coordinates of path 1 are shown.
| path 0: | ||||||||
| path 1: | x0 | y0 | x1 | y1 | x2 | y2 | x3 | y3 |
| path 2: |
Alternatively, the path can be specified by two values, x and y, in each row and the number of vertices corresponds to the number of rows in the matrix. This mode is selected by setting the attribute order to "row".
The example matrix below would produce four paths with three vertices each. The coordinates of path 1 are shown.
| path 0 | path 1 | path 2 | path 3 | ||||
| x0 | y0 | ||||||
| x1 | y1 | ||||||
| x2 | y2 | ||||||
The coordinates must between 0 and 1, where (0, 0) corresponds to the top left corner of the object and (1, 1) to the bottom right. The orientation of the coordinate system can be changed using the flip_x_axis and flip_y_axis attributes and the scaling can be changed using the attributes min and max. These can also be individually set for the two axes using min_x, max_x and min_y, max_y.
Arrow heads can be drawn at the end of each path by setting the arrow attribute. To draw closed polygons, set the close attribute to yes. It is also possible to fill the interior of the path by setting the attribute fill.
A submatrix can be selected by the select and count attributes. Select sets the first column to use and count sets the number of column used, where a count of 2 indicates that four columns will be used for two vertices (or two paths if column order is set).
For data of variable length, the Path object can use the output source set by length_module and length_source to limit the number of rows that are used.
Example XML definition
  <object
    class="Path"
    module="MY_MODULE"
    source="MY_OUTPUT"
    x="0"
    y="0"
  />
Attributes
| Attribute | Description | Default |
|---|---|---|
| class | must be "Path" | |
| title | title of the object | module.source |
| x | placement of the object | |
| y | placement of the object | |
| w | width of the object | 1 |
| h | height of the object | 1 |
| module | name of the module to be visualized | |
| source | name of the output to be visualized | |
| length_module | module with length data | module |
| length_source | source with length data indicating the number of valid rows in the source | |
| order | format of the data (row, col) | col |
| select | select the first column in the source matrix to use; if not set, the whole matrix will be used | 0 |
| count | the number of vertices to use; if not set, the whole matrix will be used | |
| min | minimum value | 0 |
| max | maximum value | 1 |
| min_x | minimum value for x | min |
| max_x | maximum value for x | max |
| min_y | minimum value for y | min |
| max_y | maximum value for y | max |
| flip_x_axis | flip the coordinate system (yes, no) | "no" |
| flip_y_axis | flip the coordinate system (yes, no) | "no" |
| color* | color of the lines or color list | "yelow" |
| fill* | color for filling or color list | "none" |
| line_width* | line width in pixels | 1 |
| line_dash* | line dash pattern (see HTML 5 canvas) | [] |
| line_cap | line cap (butt, round, square) | "butt" |
| line_join | line join (miter, round, bevel) | "miter" |
| arrow* | draw arrow at end of path? (yes/no) | "no" |
| close | close the path? (yes/no) | "no" |
* For these attributes, an array can be supplied instead of a single value. Each line will pick the next value from the array, for example "red, green" will color every other line red and the others green.
Author
Christian Balkenius
Lund University Cognitive Science
christian.balkenius@lucs.lu.se
Files
Path.js